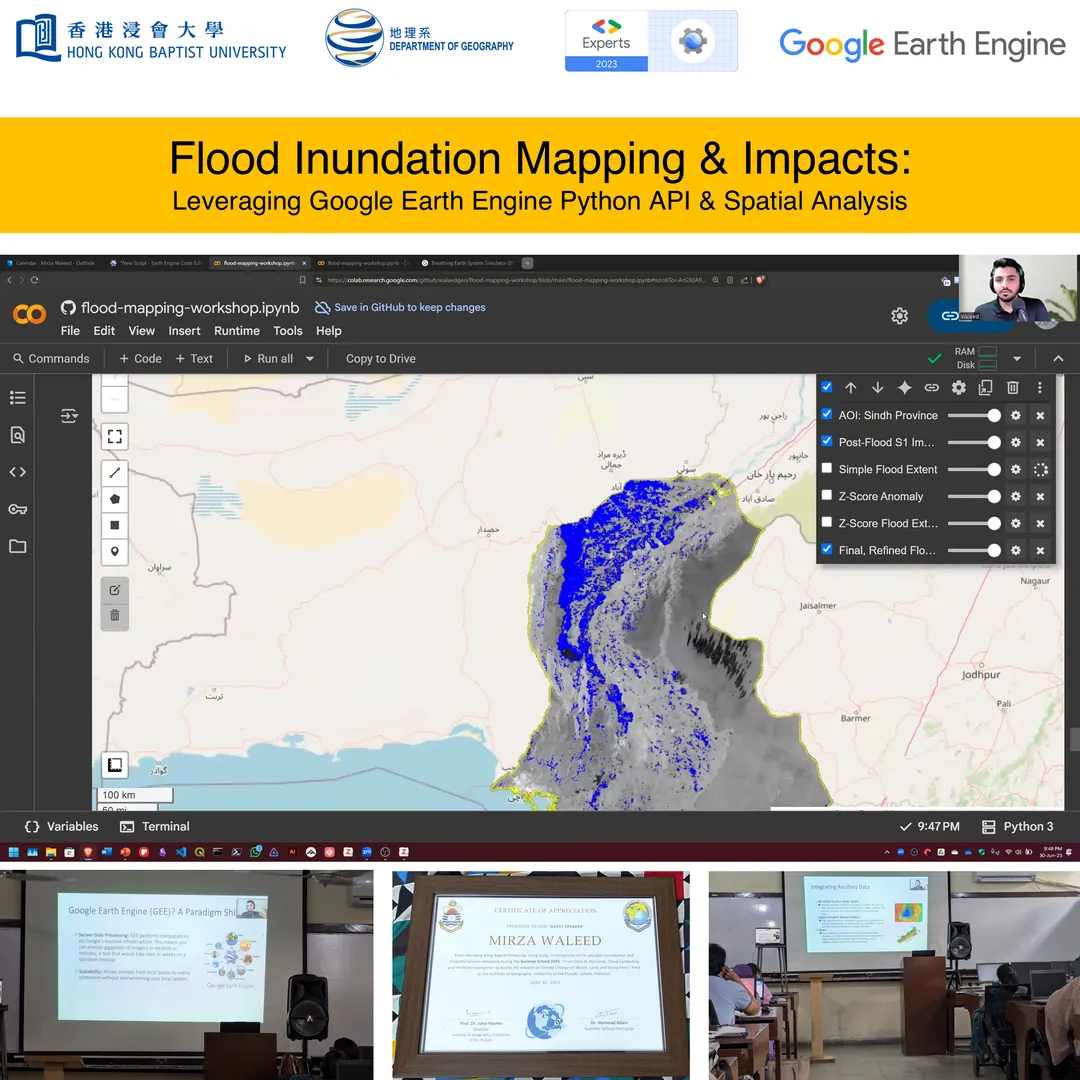
Flood Inundation Mapping & Impacts: Leveraging Google Earth Engine Python API and Spatial Analytics
Complete guide to satellite imagery analysis using Google Earth Engine and Python for environmental monitoring and climate research.
A Comprehensive Guide to Large-Area Flood Mapping 🛰️
This summer (2025), I had the pleasure of presenting at a virtual summer school hosted by Punjab University, Pakistan, sharing insights into how we can leverage cutting-edge geospatial technologies to tackle the global challenge of flood inundation. This post provides a summary of my workshop, which focused on using Google Earth Engine (GEE) and advanced analytical techniques to map and understand flood impacts at a large scale.
The Imperative: Why Large-Area Flood Mapping Matters
Flooding is the world's most common natural disaster, and its frequency and intensity are only increasing due to climate change. Traditional methods of surveying floods, such as on-the-ground measurements and aerial reconnaissance, are often too slow, costly, and limited in scale to be effective during a widespread crisis. We urgently need rapid, cost-effective, and scalable methods to map flood inundation to aid humanitarian response, assess damage, and inform future preparedness.
A Paradigm Shift with Google Earth Engine
Enter Google Earth Engine (GEE), a cloud-based platform for planetary-scale geospatial analysis. GEE represents a true paradigm shift in how we approach environmental science. Instead of downloading terabytes of data to a local machine, GEE brings the computation to the data on Google’s massive cloud infrastructure.
Key advantages of GEE:
- Vast Data Catalog: Instant access to over 80 petabytes of satellite imagery and other geospatial datasets.
- Server-Side Processing: Analyze massive datasets in minutes, not days.
- Scalability: Analyze areas from local basins to entire continents without overwhelming your local system.
The "Eyes Through the Clouds": Sentinel-1 SAR
While optical satellites (like Landsat or Sentinel-2) are blocked by clouds, the Sentinel-1 satellite uses Synthetic Aperture Radar (SAR) to "see" through cloud cover and darkness. . This is absolutely critical for flood mapping, as these events often occur during heavy rainfall and under persistent cloud cover.
SAR works by sending out microwave signals and recording the energy that reflects back. Smooth surfaces, like calm water, reflect the signal away from the sensor, appearing as a dark pixel (low backscatter). In contrast, land and vegetation scatter the signal, appearing as brighter pixels (high backscatter). This distinct signature is key to identifying inundated areas.
From Simple to Sophisticated: The Power of Z-Scores
The most basic method for flood mapping with SAR is simple thresholding, where any pixel with a backscatter value below a certain number is classified as water. However, this method is prone to errors, as a single value rarely works perfectly across diverse terrains.
To overcome this, we can use a more robust statistical approach: the Z-score. This method quantifies how anomalous a pixel's backscatter value is compared to its own historical average.
The Z-score method:
- It compares the post-flood backscatter value of a pixel to its pre-flood historical mean.
- A significantly negative Z-score indicates that the pixel's current value is much lower than its historical average, making it highly probable that the area is now covered by water.
- This approach is more reliable because it accounts for the unique characteristics of each pixel, reducing false positives.
Refining Flood Maps with Ancillary Data
While SAR is powerful, its accuracy is significantly improved by integrating it with other datasets available in GEE.
- JRC Global Surface Water (GSW): Used to mask out permanent water bodies (rivers, lakes) so we can map new flood inundation.
- Digital Elevation Models (DEMs): Essential for filtering out false positives in high-elevation areas and, more importantly, for estimating flood depth, which is vital for damage assessment.
- Slope Data: Used to remove erroneous detections on steep terrain where radar shadows might be mistaken for water.
By synergistically combining our SAR-derived flood mask with these auxiliary datasets, we can produce highly refined and accurate flood inundation maps.
From Inundation to Impact: Driving Real-World Solutions
The ultimate goal of flood mapping is to drive impact. These maps are the foundation for:
- Rapid Response: Directing emergency services and aid to the most affected areas.
- Damage Assessment: Quantifying the impact on infrastructure, agriculture, and populations.
- Risk Modeling: Feeding into predictive models and early warning systems to build more resilient communities.
My own research, with a strong focus on the devastating Pakistan floods of 2022, moves beyond simple mapping towards predictive intelligence, empowering proactive management rather than just reactive responses.
The Journey Ahead: Python in Earth Engine
While GEE has a JavaScript API, the Python API unlocks a new level of power and flexibility. It allows us to integrate GEE with a vast ecosystem of scientific libraries and develop more sophisticated, reproducible, and scalable workflows. This is particularly relevant for collaborative projects and for developing standalone applications.
.
For those interested in getting started, the geemap library, which is built on top of the GEE Python API, makes interactive mapping and data exploration incredibly intuitive within Jupyter environments like Google Colab, requiring no local setup.
Thank you to everyone at Punjab University for the opportunity to share this knowledge. I hope it inspires more researchers and practitioners to leverage these powerful tools to build a more resilient future.
For questions about the workshop or collaboration opportunities, feel free to connect via LinkedIn or check out the code repository on GitHub.